Data Analysis
Table 1 : The average height of the waves on the different types of wave breakers
Test 1 (cm)
|
Test 2 (cm)
|
Test 3 (cm)
|
Test 4 (cm)
|
Average(cm)
| |
Concave
| |||||
Convex
| |||||
Triangular
| |||||
Flat
|
Graph 1 : Empty graph which will be used to compare the effectivity of wave breakers.
3. Results
3.1 Sampling sites
We sampled the results in the Science Laboratory and under the staircase. The experiment was originally started in the Science Laboratory, under the eye of the lab manager. However, due to faults in the silicone sealant, the Liquid Glue gave way under constant pressure, and flooded the laboratory. Therefore, we shifted our experiment to a safer location.
3.2 Experiment 1 results
Table 1 : The average height of the waves on the different types of wave breakers
Test 1 (cm)
|
Test 2 (cm)
|
Test 3 (cm)
|
Test 4 (cm)
|
Average(cm)
| |
Concave
|
13.2
|
13.5
|
13.3
|
13.2
|
13.3
|
Convex
|
15.5
|
15.6
|
16.2
|
15.9
|
15.8
|
Triangular
|
14.3
|
14.6
|
14.4
|
14.6
|
14.5
|
Flat
|
15.3
|
15.4
|
16.7
|
15.7
|
15.8
|
Graph 1 : The height of the waves at different areas of the acrylic tank on different wavebreakers
3.3 Experiment 2 results
Table 2 : The average height of the waves on the different types of wave breakers
Test 1 (cm)
|
Test 2 (cm)
|
Test 3 (cm)
|
Test 4 (cm)
|
Average(cm)
| |
Concave
|
13.4
|
13.2
|
13.5
|
13.7
|
13.5
|
Convex
|
15.5
|
15.6
|
15.6
|
15.3
|
15.5
|
Triangular
|
14.2
|
14.5
|
12.5
|
12.9
|
13.8
|
Flat
|
15.6
|
16.1
|
16.6
|
15.5
|
16.0
|
Graph 2 : The height of the waves at different areas of the acrylic tank on different wavebreakers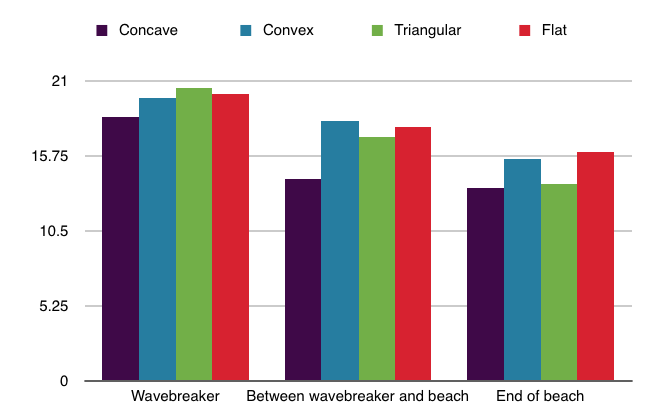
3.5 Special observations
We observed that the results of the waves were not consistent. In addition to that, we also observed that there was a very large backwash occurring to the artificial beach, which swept the small pebbles out into the back of the tank. We also observed that the sand eroded away the silicon and made the tank leak.
No comments:
Post a Comment